Business
How RFP Software Helps Metal Toad Be More Effective
How RFP Software Boosts Efficiency at Metal Toad: Learn how Metal Toad leverages RFPIO to streamline RFP responses, save time, and improve...
Discover how Metal Toad leverages advanced monitoring tools to ensure high availability and rapid response for their AWS Managed Services, delivering on stringent SLAs.

So if you didn’t know, Metal Toad has been growing an AWS Managed Services hosting business. We offer our clients enterprise level hosting, ranging from single server all-in-one LAMP, up to fully-customized Custom Clouds with clusters of Varnish, Apache and Memcache servers, hot-failover DBs, and multi-region HA. Despite a wide range in complexity (and cost), we promise all our clients the same things; low downtime, fast response times, and access to Metal Toad’s depth of knowledge. In terms of people, this means we have a staff who take turns being on-call, responding to issues as they arise. On the business side, this translates into an SLA that is included in each contract. The SLA is split into incident priorities, with response/resolution timelines for each priority. For most of our clients, their SLA looks like the following:
Significant impact on clients operations
The Service or a major component is down
No alternatives/workarounds available
Client operations impacted
Any service or component is down/malfunctioning
A temporary alternative or workaround is available
Effective use of Service is not possible
Minor impact on operations
Infrequently occurring problem
Service requests
Bug fixes
Feature improvements
30 minute response
4 hour resolution
1 hour response
24 hour resolution
1 Business day response
5 Business day resolution
1 Business day response
Resolution on a business justified schedule (usually coinciding with the next major release)
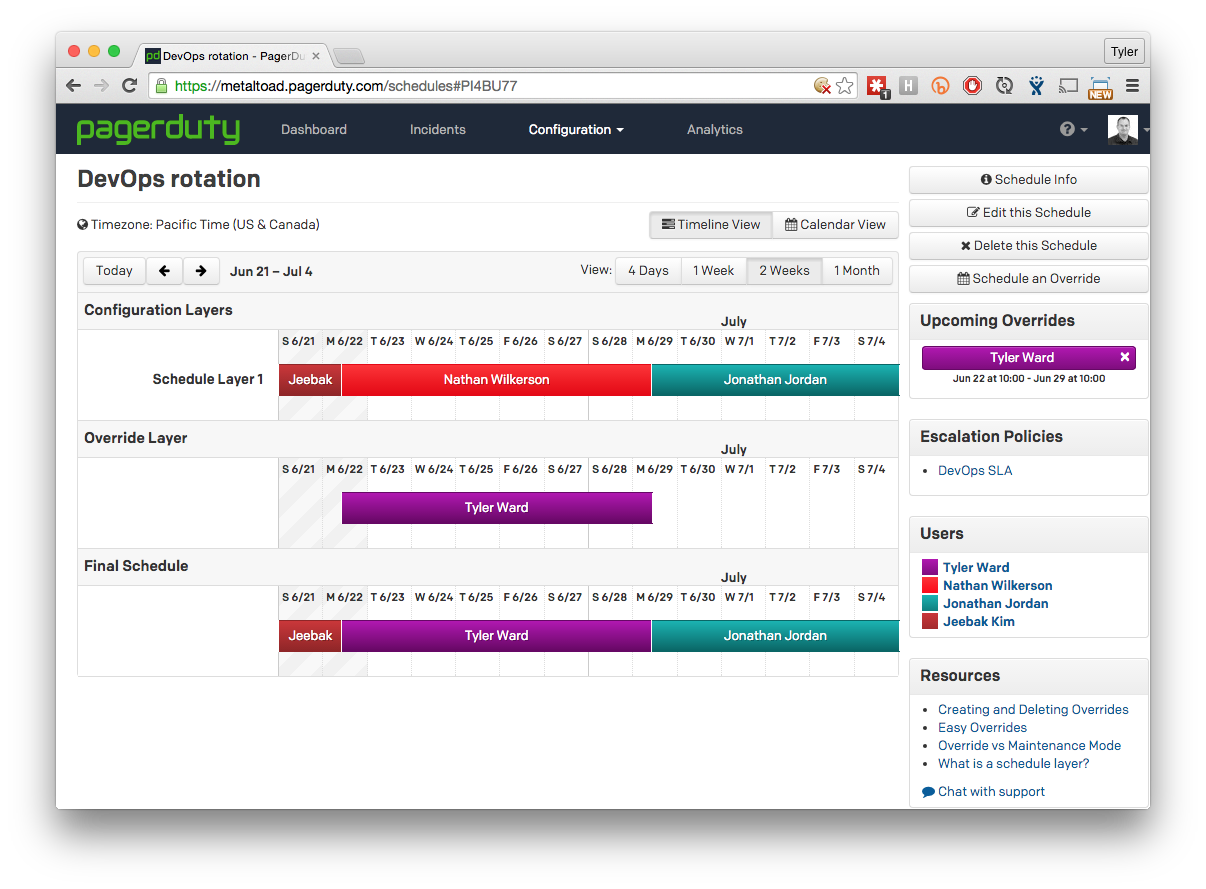
So we promise that we’ll let you know if we notice something going awry, and work to fix the issue as fast as possible. But what if it’s the middle of the night? How do we even know if something is happening without a client telling us? I’ll admit, when I came to Metal Toad, this was a problem. We had what was affectionately known as ‘The Frog Phone’ (Copper Frog Hosting was the original name of our hosting business, it has since been integrated with Metal Toad). There was an established rotation of staff, we would each take the phone with us for a week, and hope that incoming emails, text messages, or customer calling would raise you out of your sleep. Well, if you were on-edge, expecting something to go wrong, this worked. But, far more often than we liked, it did not. If you’re going to offer enterprise class hosting, that’s just not acceptable. Beyond that, there was no reliable way of reporting on incidents and responses, since almost every part of our process was manual!
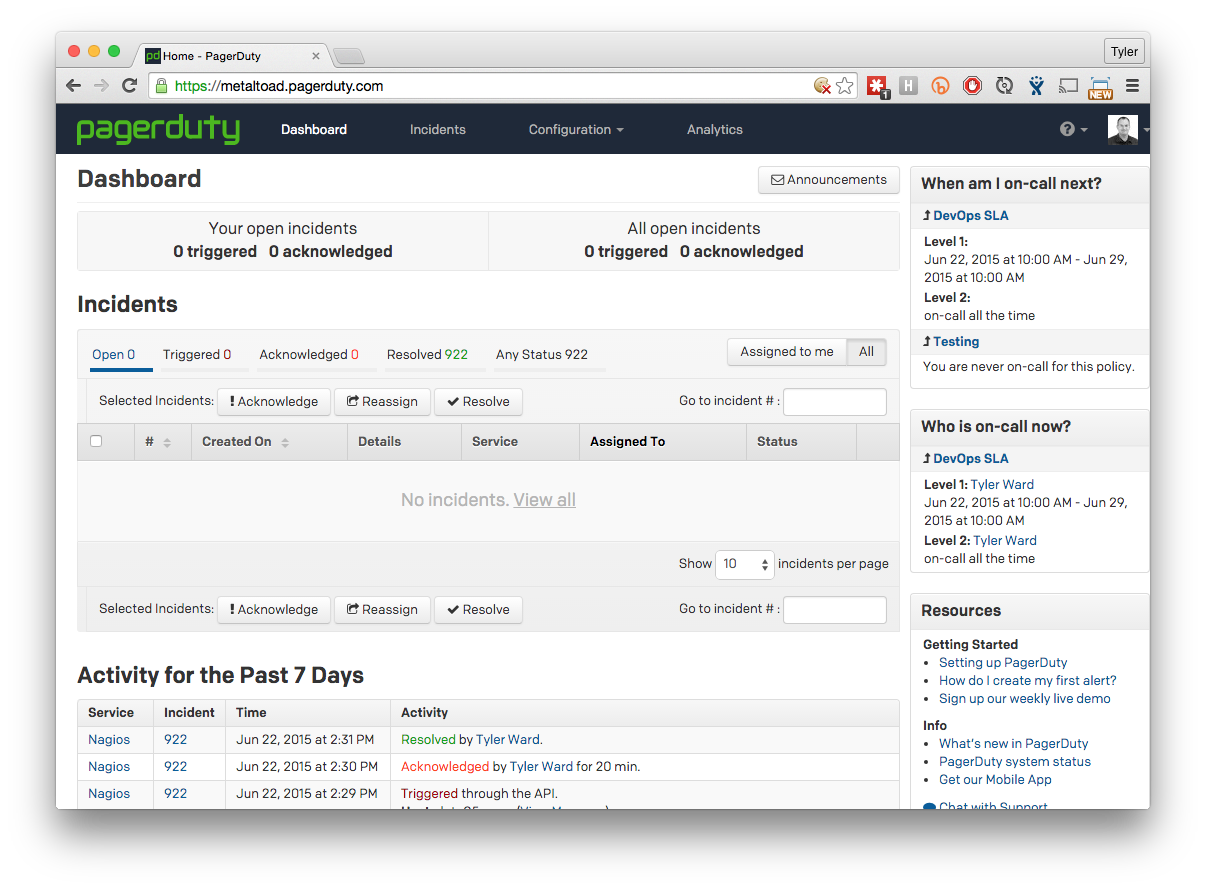
So, I took that as a challenge. How could we make improvements to our monitoring & notification systems? At this point, the only thing we knew that we were looking for was something not-built-here. Home rolled/hosted is nice, but our business was in a changing mode, we had decided to ‘get rid of power buttons’ and move into having our systems on AWS. This meant I wasn’t looking for just a tool which could integrate with our current suite of monitoring systems, it also needed the ability to expand with us into 'the cloud'. A little bit of this research became a ‘who’s on first’ bit, with research in dispatch/notification services leading to discovering new monitoring tools, and some monitoring tools leading back to other dispatch/notification services. After a few trials and rounds of testing, we decided to use PagerDuty to handle incident notifications to the on-call staff.
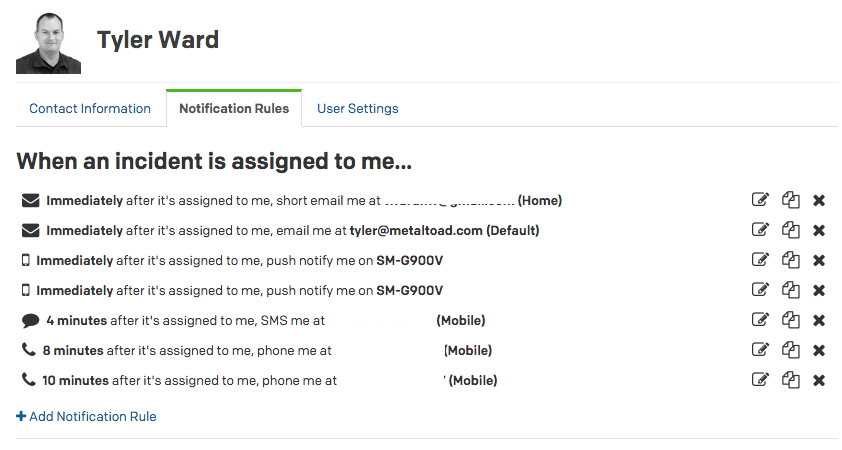
PagerDuty is hugely flexible to meet the needs of our team. Here’s a list of the things we loved:
Great, we solved the problem of being able to send a notification to whomever is on-call, and we can easily track issue response and resolution. Then our attention turns to gathering data on which to trigger alerts. Historically, we relied on three tools for monitoring and alerting.
You all know it, and love and hate it. Monitoring just about everything on servers in our Colo. CPU stats, memory, logged in users, drive space, Apache, Varnish. You name it, we likely have a monitor on it, sometimes whether we need it or not.
Nagios is great for binary checks (is the drive above 90%?), it doesn’t help with any graphing or surfacing trends. So, all the systems we have in our colo are also monitored with Munin. We don’t trigger many alerts off Munin, but it is nice to do a scrub of a cluster and watch for trends.
Internal monitoring is great, but if a WAN link fails or DNS goes down, an external service for monitoring sites is required.
These three tools have been the backbone of our monitoring since Copper Frog’s inception. But they started to have problems when we began spinning up more and more services in AWS (or elsewhere). Due to security requirements on some of our clients infrastructure, Nagios and Munin were not able to easily communicate with some systems. They don’t scale automatically (you have to put an entry in a config for each server you want to monitor). So, we expanded our systems monitoring with:
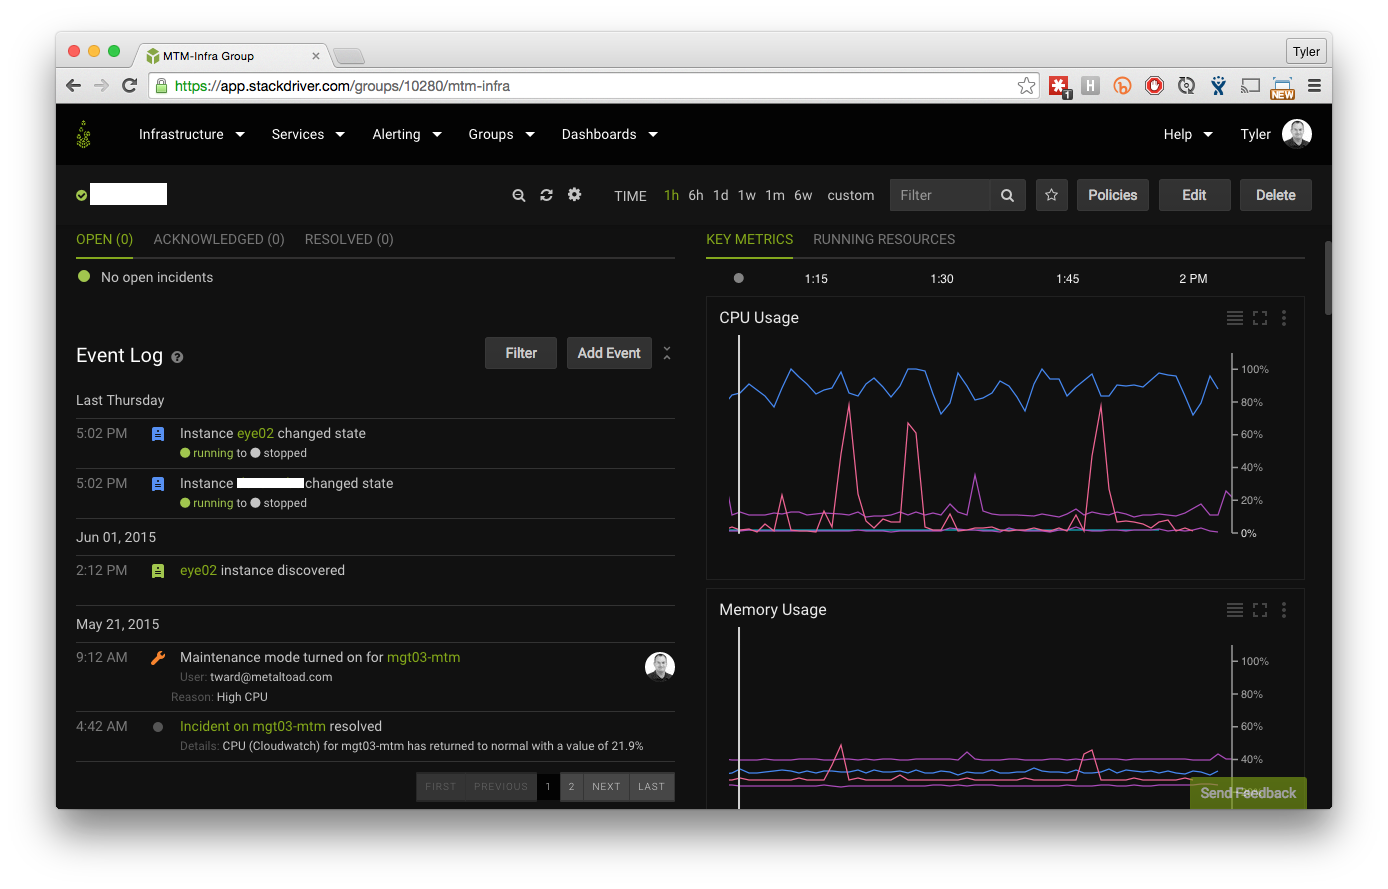
My favorite part of Stackdriver is setting up a new client. As soon as we set up our cross-account role (link to previous blog post), we immediately create a second role, this one for Stackdriver. This means, at minimum, we have metrics on any instance in the account, with a standard CloudWatch 5-minute averaging, without having to install a single thing. However, as soon as a new instance is created, Puppet install the Stackdriver Agent, which we then use to push even more metrics over to Stackdriver, and at a higher frequency. We use this tool to monitor everything from Apache accesses, to CPU steal to avoid a ‘noisy neighbor’.
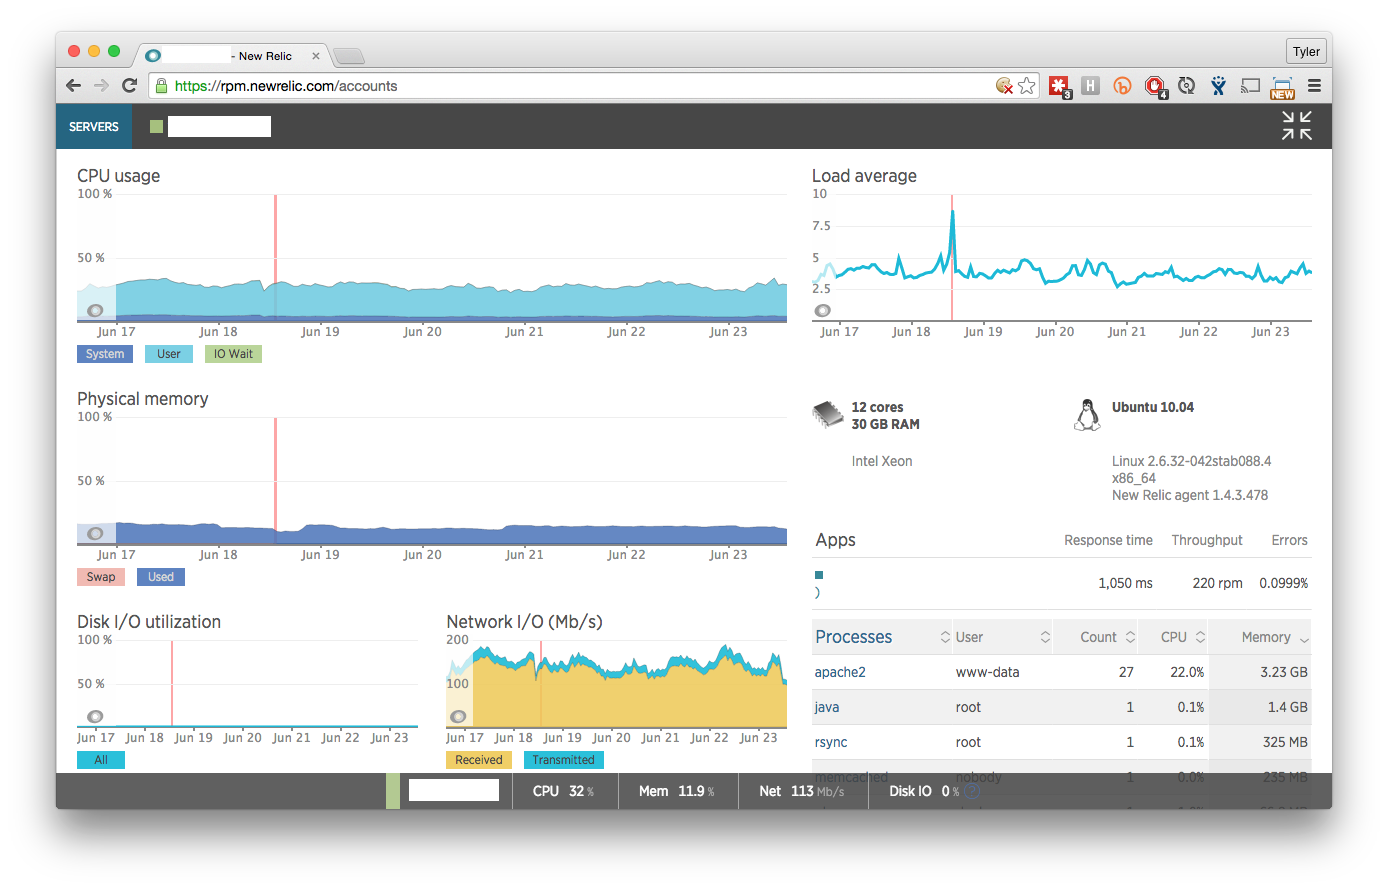
We have used New Relic for application monitoring for years. It is a fantastic tool for that. But recently, one of our clients has begun moving their systems to a company-owned datacenter (yes, we’ll even provide Managed Services on systems we don’t own!), and we need to utilize their monitoring systems. They chose New Relic for system monitoring, so we are utilizing it’s tie-in to PagerDuty to feed us those alerts. In similar fashion to Stackdriver, for this client we have a Chef (yes, we’re Puppet AND Chef pros) recipe to install New Relic on any system that is added to the infrastructure we manage there.
For the same client, we are using Sumo Logic to receive and process system and application logs. We’re still building out this piece, but in the near future we will have PagerDuty alert based on log events from here.
That handles all of the automated system and application monitoring for us, leaving monitoring of emails, and phone calls. Phone calls, are still a work in progress. While we don’t hand the phone around the room any more, we do forward a phone number to the on-call individuals phone. This means that our hosting clients are given a phone number and can call it for support anytime, 24/7, and they will talk to the person who is going to solve their problem. No phone tree to navigate, no ‘press 1 to continue’, just straight to the engineer. To solve tracking of email, we utilize:
Kayako is a web-portal and email based customer service product. We have our support address piped into their system, and an incoming email or new ticket immediately notifies the assigned team. Clients can chose the priority of their request based on the terms defined above, and if it is a Priority 1 or 2 issue, it then opens an incident in PagerDuty, letting the on-call engineer know. This tool filled a big gap with email. While we had a shared email box for a long time, being able to track and report on incident response was a long arduous process of tracking down emails and checking response times. Kayako lets us specify different SLA’s and response/resolution timelines and build reports on those to make sure we are holding up to our promise.
So, let's assume for a bit that you're hosting with Metal Toad, and, unbeknownst to you, your site has gone down. Depending on the reason, within a few short minutes, our monitoring tools have created an incident in Pager Duty and notified the on-call engineer. They roll out of bed, flip on their laptop, fire off an email to the client, and immediately go to work resolving the problem.
How RFP Software Boosts Efficiency at Metal Toad: Learn how Metal Toad leverages RFPIO to streamline RFP responses, save time, and improve...
Metal Toad's PM department improved processes, hired the right talent, and created a strong team, now moving towards enhancing client services.
Efficient onboarding transforms new hires into confident, knowledgeable, and productive team members through structured, incremental tasks.