Artificial Intelligence
How Much Does a Website Cost? 1 of 3: Initial Purchase
"How much does a website cost?" These are six words — when spoken in sequence — that most web developers dread.
In my last post, I wrote about the cost of tech debt, using a case study of skyrocketing hardware costs.

In my last post, I wrote about the cost of tech debt, using a case study of skyrocketing hardware costs. Here's another, subtler effect of poor performance: impatient customers don't stick around when they experience slowdowns. However, choosing to prioritize speed can be hard to justify when the cost isn't quantified.
Here's a quick experiment using one of my favorite data science toolkits: SciPy and Jupyter. By downloading the page load times from Google Analytics, and comparing it to the conversion rate (how often people buy stuff), it's possible to place an actual dollar value on page speed, unique to your audience.
For the site in the case study, the average page load time is 8.6 seconds and the opportunity cost is $285,000 annually for each extra second of page load time!
To create the chart, each data point from Google Analytics (a one hour interval) is charted on a scatterplot. In order to visualize the large volume of data, points are grouped into hexagonal areas, and brighter areas contain more points.
A curve fit to ?⋅?(?⋅?) reveals the overall pattern. The slope of this curve predicts how much revenue is gained or lost by one second of page load time.
If this site could trim two seconds off page load time, the expected return would be over half a million dollars per year. For most executives I've worked with, this is a totally non-intuitive result. That is why I believe it's crucial to use evidence-based, economic logic when making prioritization decisions.
There are no doubt imperfections in the model. For example, we do not know how many customers might return later and still complete their purchase, or how many would never return, or even become brand detractors and influence their social connections to shop elsewhere. However, the goal is to improve decisions, not make them perfect. If the starting point is no information, then the bar is very low.
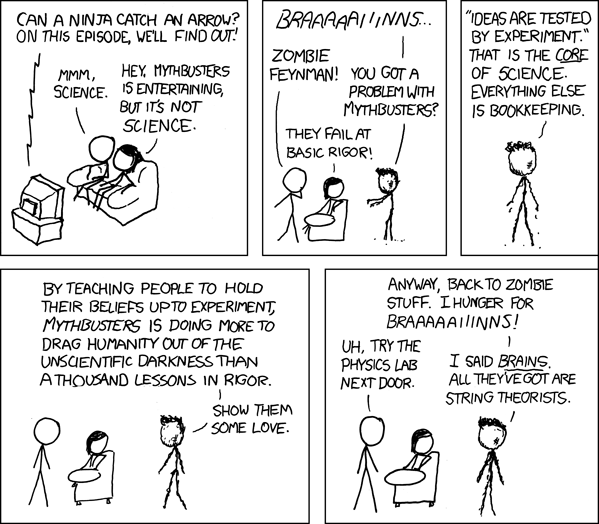
Zombie Feynman (via xkcd) sums this up perfectly:
Ideas are tested by experiment. . . . Everything else is bookkeeping.
If you want to experiment with your own data, download the Jupyter notebook. 
To export the data from Google Analytics, first create custom report. Set the dimensions to "hour index" and the metrics to "avg. page load time" and "goal conversions". Then export the report as a CSV, and load the data into the Jupyter notebook.
"How much does a website cost?" These are six words — when spoken in sequence — that most web developers dread.
A good framework for most people to help understand these costs is to look at buying a website like buying a house. After you've bought it you still...
In my last article, I addressed the age old question "how much does a website cost?" from the stand