Find the curves to estimate meeting and project management time (almost) perfectly for your projects! We call it Meeting Overhead Efficiency Theory and Project Overhead Efficiency Theory, or MOET and POET for all of you acronym lovers.
The Background
A recent discussion focused on how we calculate project management and meeting time as a part of our overall project estimates. Historically we have used a flat percentage based upon the total number of project hours to estimate the project management and meeting overhead. It varied based upon the anticipated complexity of the project and client needs, but usually 10% overhead for project management and 10% overhead for meetings was our go-to. However, I suspected that while this might capture an overall average for our projects, scope and timeline could have a strong influence on the number of meetings and the amount of time a project manager has to invest in a project.
The Hypothesis
Our hypothesis was that a more realistic estimate for project management and meetings would be based upon the project scope and the overall project timeline. My guess was that the longer the project timeline relative to the scope of the project, the higher the percentage of the overall budget that would be spent on project management and meetings. However, I also suspected that on the other end of the spectrum, a project with a large scope and a rushed timeline would also incur more project management and meeting time than normal. This generally fits Brooke's Law and its corollary from The Mythical Man-Month that adding additional developers to a project makes it take more time, not less.
The Methodology
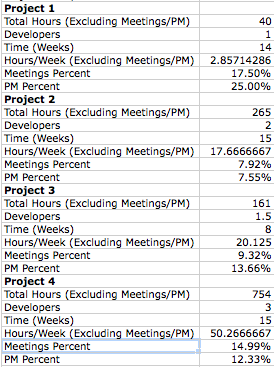
First, I needed some real data. I took a look at a wide range of projects we've completed during 2011. The projects include the following:
- Only projects we completed with clear start and finish endpoints, rather than ongoing ESAs, feature development, or support
- A wide range in scope and timeline, including our smallest and largest projects as well as those that were on a rushed timeline and some that were very drawn out
- Projects with numerous different project managers taking the lead
I looked at projects in terms of hours (scope) and weeks (timeline). For hours, I added up time spent outside of meeting and project management time (planning & discovery, development, quality assurance, deployment, etc.), I considered several different ways of analyzing the data, but the figure that consistently captured scope, timeline, and number of developers on a project was simply hours per week (total project hours divided by number of weeks scheduled to complete). Keep in mind that the hours/week number is an average over the entire length of the project, and during core development periods the actual hours per week may be much higher, while others in the planning phase or nearing go-live may be much lower.
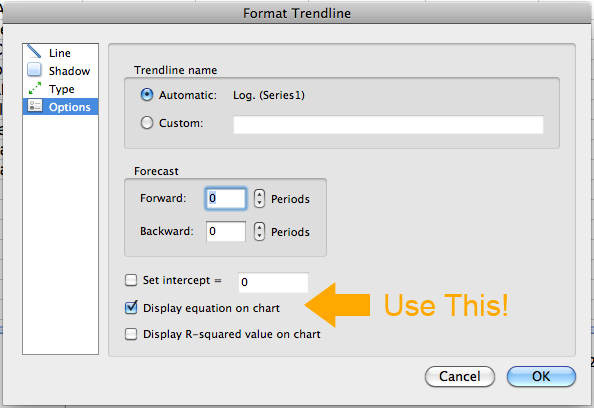
I took the hours/week figure for each project and created scatter charts of the data, and then used Excel to graph the trendlines for the data, looking for the best curve fit between linear, logarithmic, and 2nd/3rd order polynomials. Then I spent the better part of an hour using my rusty high school/college calculus skills remembering how to come up with equations to fit the curves. After finally having success, I stumbled across the checkbox option in Excel "show trendline equation". D'oh! At least it was rewarding to know I can still do some calculus.
Using the equations, it was simple to create a function that outputs estimated PM and meeting percentages based upon inputs of project hours and weeks.
Our Results
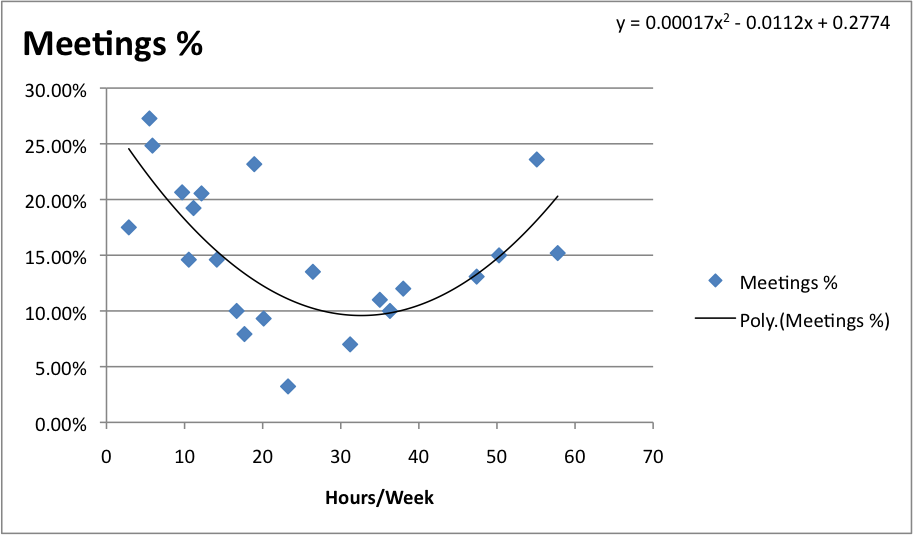
When graphed, our projects show fairly clear trends in both project management and meeting percentages. Meetings showed a very clear inverse curve, with a sweet spot for meetings as a percentage of project total for projects between approximately 30-40 hours per week. The data was best fit by a 2nd order polynomial with the trendline curve equation y = 0.00017x2 - 0.0112x + 0.2774. However, past approximately 60 hours/week, the equation breaks down. It's not realistic that a 100 hour/week project would incur 100% project management overhead. If we extrapolated data for projects with a greater hours/week ratio, a 3rd order polynomial might be a better fit. For our estimation purposes, we simply said that for projects with greater than 60 hours per week, meetings top out at the 60 hour/week percentage.
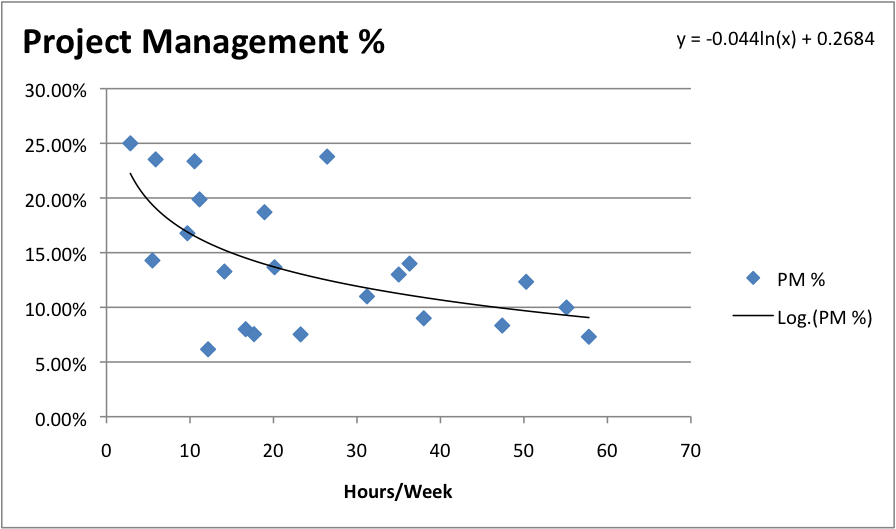
Project management data was better fit by a logarithmic curve with the equation y = -0.44ln(x) + 0.2684. Again, it's not realistic that the downward trend in PM overhead would continue to the point of being a negative number, so for our estimation purposes, we said that for projects with greater than 60 hours per week, project management tops out at the 60 hour/week percentage.
The Conclusion
Based on our data, our hypothesis was very accurate when it comes to meetings. Projects with a low hours/week ratio incur higher meeting overhead, as do projects with a high hours/week ratio. On the low end, a project that is drawn out will continue to have meetings, calls, and check-ins even if development work is stalling. On the high end, a project with lots of developers involved and lots of development time each week is also often going to be a large scope project with many stakeholders, and keeping everyone on the same page means having a lot of meetings and calls. Brooke's Law in action!
Project management told a slightly different story. Projects with a low hours/week ratio had higher project management overhead. This was as expected, since projects that get drawn out still have requests coming in from clients and project managers will check in on the project continually whether or not development is happening rapidly. However, we found that projects with a high hours/week ratio experience increasing efficiency when it comes to project management. Total project management hours will still increase, but relative to the overall project scope, the percentage of the project hours that are spent on project management will decrease. That's a good thing, though as a project manager it's a bit hard to wrap my head around since it often feels like our big projects can very easily consume all of our time.
Based on our results, here are our theories (we're still calling them theories until we have more data to confirm "law" status):
Meeting Overhead Efficiency Theory (MOET) - Projects with both a low and a high scope to timeline ratio will incur the greatest overhead in meeting time as a percentage of total project hours. Every organization will have a "sweet spot" in terms meeting percentage efficiency that occurs with mid-sized projects over a reasonable timeline without unnecessary delays or rushing to completion.
Project Overhead Efficiency Theory (POET) - Projects with a low scope to timeline ratio will incur the greatest overhead in project management time as a percentage of total project hours. Increasing efficiency can be gained in project management by shortening the timeline of a project or increasing the project scope, all else equal.
Do MOET and POET Hold Up?
Whether you're a similar development shop, a corporation that tracks project hours, or a freelancer that tracks meeting and project management time, we're curious to see if our results follow fairly universal trends. Take a look at your data and let us know what you find!
TL;DR
We took a look at our project data to confirm that timeline and project scope can have a pretty significant impact on the amount of meeting and project management overhead required for a project. It's intuitive, but now there are numbers to back our assumptions up. Read the post to see how we put together estimation curves that match reality much better than a flat-line estimate.